As it's name implies, the Virtual Crossover is capable of replacing or simulating a real crossover. By "real" crossover I mean either a passive speaker crossover consisting of resistors, inductors and capacitors, or an active crossover with opamps, resistors and capacitors; in other words, a crossover that can be realized with an actual physical circuit. The method that the Virtual Crossover uses to simulate real circuits is described in some detail elsewhere on this website. Basically, it uses the impulse response to characterize the network (actually it uses the FFT or Fast Fourier Transform of the impulse response, since the calculations are carried out in the frequency domain).
However, the Virtual Crossover is not limited to it's ability to model real circuits. It was originally conceived as a tool that would be useful at every stage of designing a speaker system. As an example, let's say that you want to design a speaker system for a particular set of drivers using a passive crossover. One of the first things you need to know is the response of the drivers, in order to determine driver quality and whether the drivers will be compatible in the system.
The Virtual Crossover is capable of carrying out driver response measurements (however it does not include a microphone or a microphone preamp - these components must be provided separately). The basic method of measuring drivers is to apply a stimulus, and then measure the response to that stimulus. The software provided with the Virtual Crossover includes two pre-defined types of measuring signals, MLS sequences and sine waves. Also, there is an option to load any external waveform from a file as the measuring excitation; this waveform could, for example, be a filtered pulse waveform for determining the pulse response of the speaker system. When the waveform is loaded, the user is asked whether or not it is to be periodic. An example of a periodic waveform would be a sine wave, where each cycle follows the last without interruption; an example of a non-periodic waveform would be a localized pulse, where there is a delay between applications of the waveform. This option allows the Virtual Crossover to operate essentially as an arbitrary waveform generator (however with one caveat - the Virtual Crossover uses a Codec to generate its output, and the Codec has a band-limited impulse response; this means, for example, that if you told the Virtual Crossover to output a unit impulse, what you would actually see is the impulse response of the Codec).
The software provided with the Virtual Crossover includes
plotting routines to view the measurement
results in the time domain, and it also
includes FFT routines to calculate the
complex response in the frequency domain.
If MLS is selected as the measurement
excitation, the software can either
display the raw output of the measurement,
or it can perform a cross-correlation
to obtain the impulse response of the
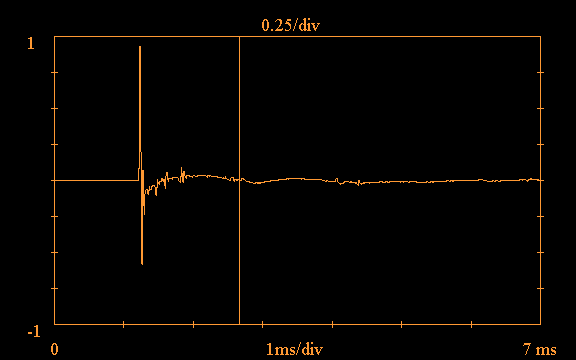
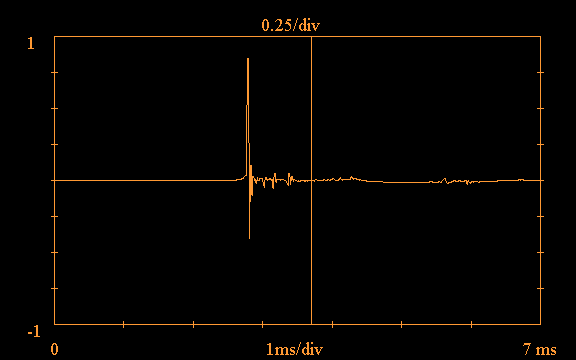
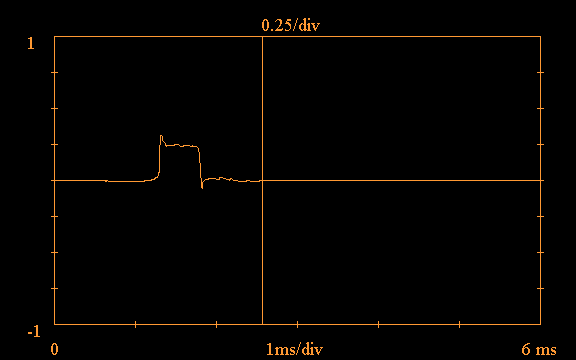
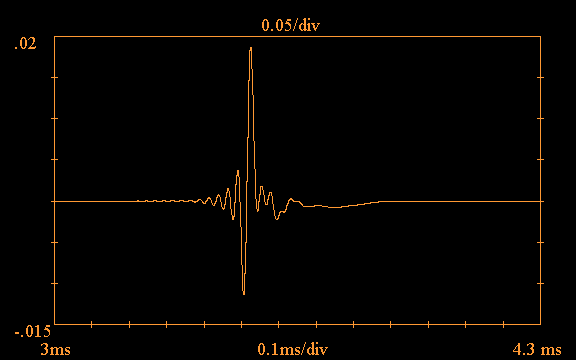
device under test. Here is an example showing
the time domain impulse response of a
Vifa H26TG-35 tweeter mounted in a baffle,
obtained using an
MLS sequence as excitation:
Note the vertical line at approximately 1.8ms in the above plot; the software provides the option of truncating the impulse response, in order to carry out a "quasi-anechoic" measurement. If this option is selected, the software ignores all data to the right of the truncation point, treating it as zero. This option is useful for eliminating the effects of room reflections. Such a reflection is clearly evident in the above plot just after 3.5ms.
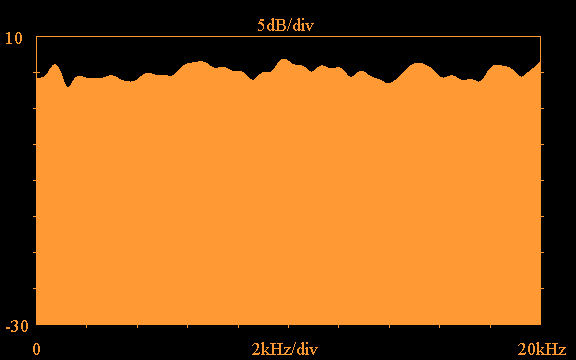
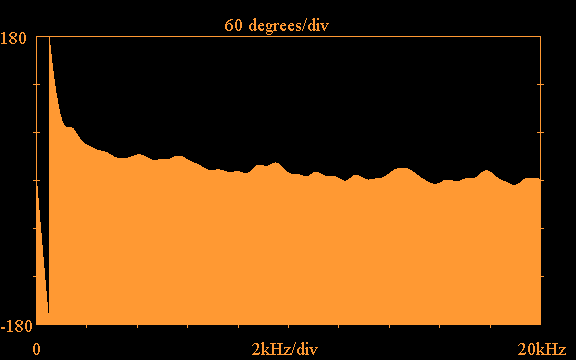
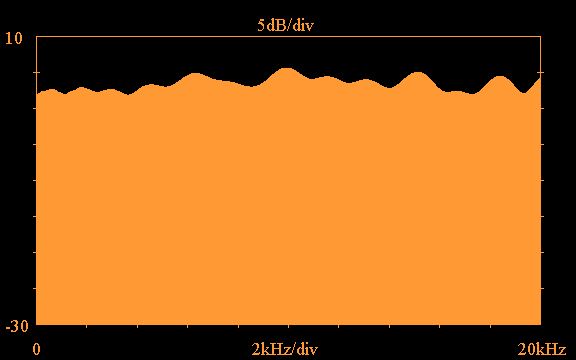
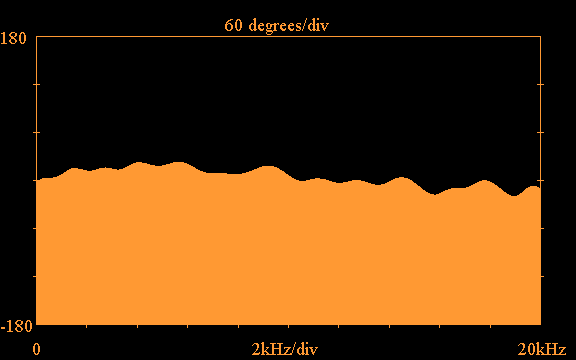
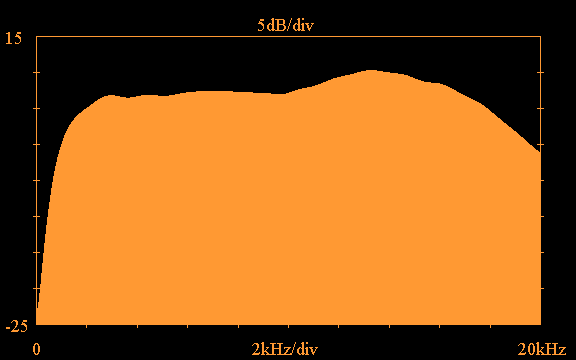
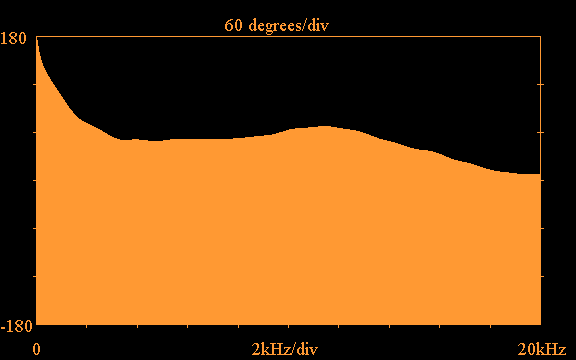
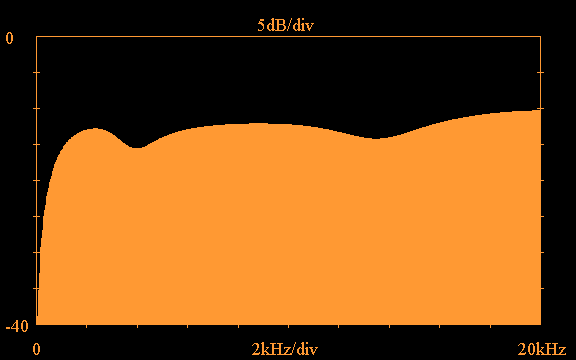
Using the truncation option with the above impulse
response and applying the FFT,
the following shows the frequency response
magnitude and phase obtained for the Vifa tweeter
plotted out to 20kHz:
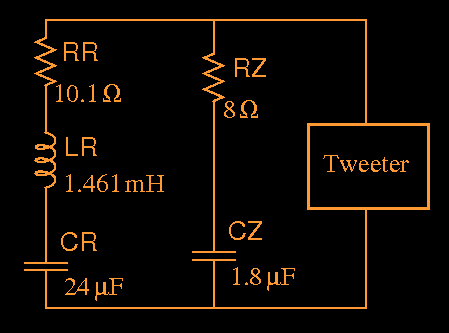
Another important consideration in passive crossover design is the interaction between the passive circuit and the driver impedance. I haven't seen a driver yet that has anything like a constant resistance for its input impedance. It is important to take this into account when designing passive crossover circuits. Therefore it is necessary to measure the driver input impedance, both magnitude and phase. The Virtual Crossover is capable of reading two channels during a measurement. Typically for impedance measurements a resistor is placed in series with the driver input, and the voltages on both sides of the resistor are measured; the differences of the voltages divided by the resistance gives the input current to the driver, and the voltage directly across the driver is also known, so we can transform the waveforms to the frequency domain and obtain the complex driver input impedance. Once the input impedance is known, the designer can come up with an impedance compensation network that transforms the driver impedance to something approximating a constant resistance. The software provided with the Virtual Crossover includes a utility called ZOBEL.C that reads in the measured driver impedance and a proposed impedance compensation network, and outputs the driver impedance as transformed by the network. This procedure is used to verify that a proposed frequency compensation network is working as desired.
Here is an example of the measured input impedance
magnitude and phase of the Vifa H26TG-35
tweeter:
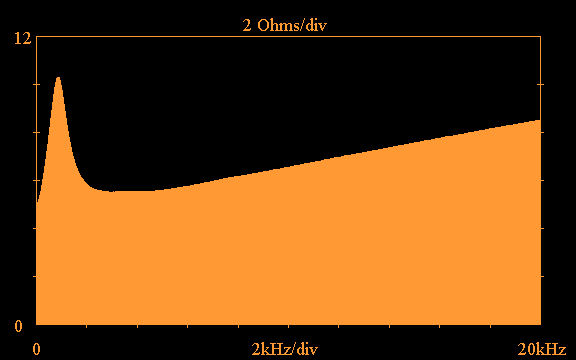
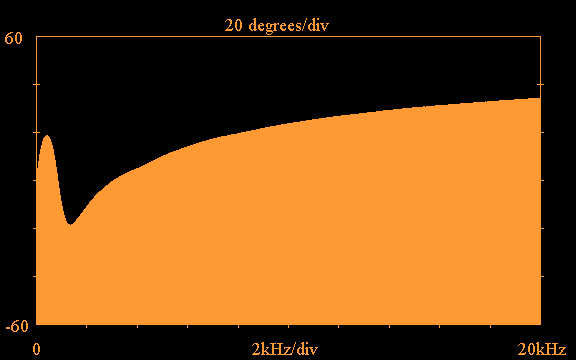
The impedance magnitude peak below 1kHz is due
to the tweeter resonance, and the rising impedance
magnitude above 4kHz is due to the voice coil
inductance. The following impedance compensation
network, when placed in parallel with the tweeter,
transforms the tweeter input impedance to a
nearly constant resistance. In this network,
the elements RZ and CZ compensate for the
voice coil inductance, and the elements RR, LR
and CR compensate for the impedance peak at
the driver resonant frequency:
After
placing the tweeter in parallel with the above
impedance compensation network using the ZOBEL.C
utility, the following transformed input impedance
magnitude is obtained:
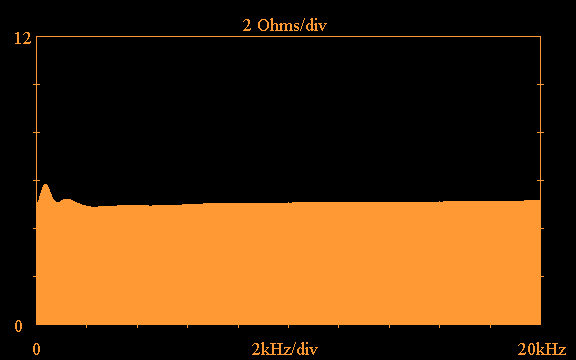
If the above compensation network were adopted in the tweeter crossover circuit, a nearly constant resistance would be presented by the tweeter to the rest of the crossover circuit.
The designer might eventually come up
with a complete tweeter crossover circuit that
he/she wants to try, such as the following:
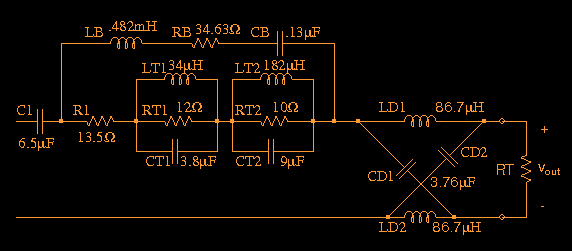
The above circuit is actually used in a tweeter crossover I developed for one of my systems that uses a Vifa D26TG-35 tweeter. Of course, it is doubtful that one would come up with the above circuit in a single step; there would probably be many intermediate steps along the way that would need to be evaluated. In this circuit, C1 implements the basic highpass function (the crossover is first-order), R1 serves to set the proper tweeter level, components RT1, LT1 and CT1 constitute a 14kHz trap, components RT2, LT2 and CT2 are a 3.93kHz trap. The trap circuits reduce amplitude peaks at the trap frequencies, either due to the tweeter response or the way in which the tweeter combines with the other driver responses. Components LB, RB and CB provide a boost around 20kHz to counteract the high-frequency roll-off of the tweeter (the RB value includes the series resistance associated with inductor LB). The elements LD1, LD2, CD1 and CD2 form an all-pass network that introduces a time delay to the tweeter response, to bring it into time alignment with the midrange response.
Normally, to evaluate such a circuit you would have to physically assemble a prototype. The idea behind tha Virtual Crossover is that you can avoid this rather tedious step. Instead of winding coils, obtaining resistor and capacitor values, and connecting everything together, you can calculate the response of the circuit, load it into the Virtual Crossover, and carry out a measurement to evaluate the crossover circuit. By carrying out similar steps for the other drivers, the entire speaker system can be evaluated for a complete set of crossover circuits.
In the above circuit RT represents the tweeter, and we require the response at Vout, which represents the waveform that the circuit will apply at the tweeter terminals. There are different ways that we can specify RT. One way is to use the measured magnitude and phase of the driver impedance, such as the data that was shown previously. A utility called IMPRSPZ.C is provided which is capable of reading in a file of complex terminating impedance data. If this option is chosen, then the impedance compensation network would have to be included in the crossover circuit, which has not been done for the above circuit. On the other hand, we can assume that we have done a good job of compensating the tweeter impedance, so that it appears almost as a constant resistance; in that case the impedance compensation network can be left out of the circuit, and a single constant resistance such as RT can be used. If a single resistance is used to represent the driver, there are still two choices as to the kind of simulation to be carried out. We can choose to use IMPRSPZ.C again, but in this case a file with a constant real impedance of value RT would be read in. Or, we can simply terminate the circuit with RT and do a time-domain simulation, using the IMPRSP.C program.
Let's assume that the above circuit is to be terminated
with a constant resistance RT=4.82 Ohms, and that
a simulation is carried out with
the IMPRSPZ.C program. As explained in more detail
elsewhere, a band-limited impulse response at
Vout must be obtained, and to accomplish this
we use an equal-ripple lowpass filter that cuts
off well above the audio frequency band. Here is
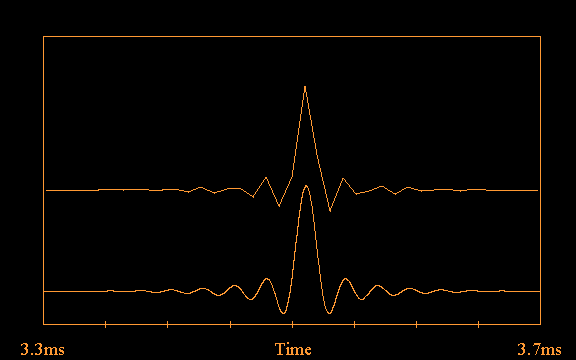
the time-domain impulse response of one such
filter that passes out to 30kHz, shown at two
different sampling rates; the upper trace is
sampled at 96kHz, as it was originally calculated
by the ERLPF.C utility, and the lower trace at 4.8MHz to
show the details of the waveform:
The frequency response of the above equal-ripple
lowpass filter is as follows:
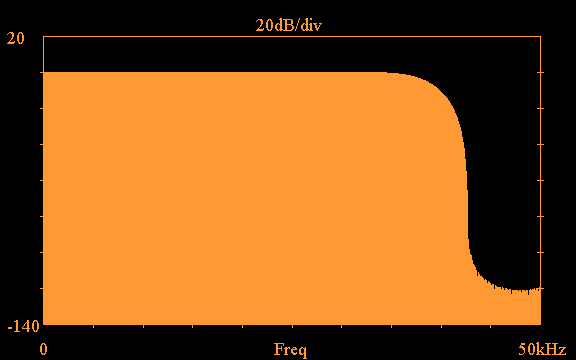
The above equal-ripple lowpass filter is applied
at the input to the crossover circuit on the
left-hand side, where the output of the amplifier
would be connected to the passive crossover.
Carrying out a simulation using IMPRSPZ.C and
assuming constant RT=4.82 Ohms, the following
response at Vout is obtained, re-sampled at
960kHz to better show the details of the
waveform:
Taking the FFT of the above waveform shows the
magnitude of the frequency response of the
tweeter crossover circuit, plotted out to
20kHz:
In the above plot, C1 is responsible for the roll-off below 2kHz; the trap circuits T1 and T2 are responsible for the dips in the frequency response; and the LB, RB, CB network produces the boost centered at 20kHz.
The above crossover circuit response can be loaded into the Virtual Crossover. By carrying out similar steps for the woofers and midrange drivers, corresponding waveforms can be loaded for those crossover circuits. Finally, either measurements can be carried out to evaluate the entire speaker system, or listening tests can be carried out by listening to music processed through the Virtual Crossover. The down side of this procedure is that separate amplifiers would be required for each driver in the speaker system, whereas a real passive crossover may require only one amplifier channel per speaker.