This page presents information about a 3-way loudspeaker that was designed using the Virtual Crossover to develop the passive crossovers for the system. This information is presented to give you an idea of the kind of development and testing that can be done with the Virtual Crossover.

The most important design goal in the development of this loudspeaker was to optimize the early arrival sound. The direct sound heard in the first few milliseconds from a speaker is extremely important to its overall subjective quality. The response of this speaker is highly accurate in both amplitude and phase. Achieving this level of accuracy requires careful attention to the time alignment of the drivers and to the development of the crossover circuits.

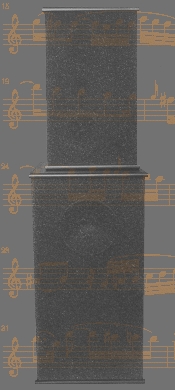
Each channel of the speaker consists of two separate enclosures, a satellite enclosure and a low-frequency enclosure. Each satellite enclosure contains one tweeter (Vifa H26TG-35) which is surrounded by two midrange drivers (Vifa P13WH) in the vertical direction; this arrangement minimizes frequency response variations. Since the tweeter and midranges are mounted on the same baffle, time alignment for these drivers is obtained using an L-C delay line network in the tweeter crossover circuit. An all-pass network is employed so that the tweeter response is not attenuated in amplitude. Time alignment between the satellite and low-frequency drivers (Meniscus W0838) is achieved by physically offsetting the satellite enclosure behind the low-frequency enclosure, which is one reason for separating the drivers in different enclosures. Other reasons for this separation are to isolate the drivers and to simplify the design requirements for the low-frequency enclosure. Yet another reason is that by adjusting the relative positions of the satellite and low-frequency enclosures, the midrange level can be tuned.

There are many different ways to approach crossover design. The method I used was to begin by looking at the individual driver responses, while mounted in the actual speaker enclosures to be used. For the satellite (midrange-tweeter) enclosure, the drivers were measured approximately six feet from the enclosure, on axis with the tweeter. For the woofer, since it is extremely difficult to obtain low-frequency information this far away from the speaker unless you have an anechoic chamber, the method of close-miking was used. I then incorporated circuits in the crossovers to compensate for some of the non-ideal characteristics observed for the drivers. Next, components must be included that implement the basic function of transitioning from one driver to the others; since I wanted to achieve excellent pulse reproduction, I basically used first-order crossover filters. Passive crossovers are used so that the loudspeaker requires only a single amplifier to drive it.

I used the Virtual Crossover in the initial development and testing of the crossover circuits; this allowed me to determine a close approximation to the final crossover circuits without having to construct any actual circuit prototypes. This procedure dramatically reduces the number of required circuit prototypes. In the final stage, circuit prototypes were made and final adjustments were made, which were necessary because the circuit models provided to the Virtual Crossover were not perfect.

At this point I want to make a comment about implementing these circuits using the Virtual Crossover. First of all, the Virtual Crossover can only do as good a job modeling a real crossover as the model that you provide for it. In my experience, inductors are the most problematic circuit elements to model. Their series resistance must be included, and it is not always sufficient simply to measure their DC resistance, because the AC resistance of inductors can be significantly greater than the DC resistance; this problem gets worse as the frequency goes up, so it is especially important for the tweeter crossover circuit. If you have coupled inductors in your circuit, the coupling coefficient must be determined, which is sometimes a difficult task. And at higher audio frequencies, parasitic capacitance between the windings of an inductor may become important. Here I simply present the nominal crossover circuits for the speaker system, without getting into these issues of component modeling.

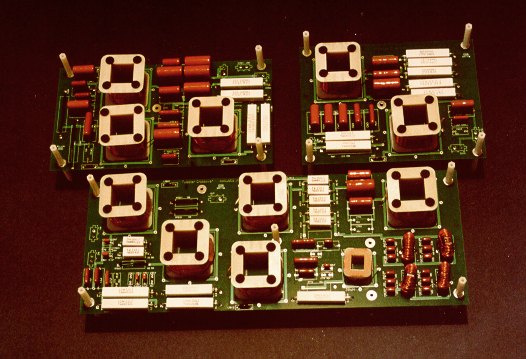
The following photo shows the assembled crossover boards for one channel, before being mounted in the satellite and low-frequency enclosures:


I next present schematics of the individual crossover circuits, along with discussions explaining the functions carried out by the crossover components.

Here is the W0838 woofer crossover circuit:


In this circuit, LW performs the basic function of first-order lowpass filter, which crosses over the woofer with the midrange and tweeter drivers. The RW2-CW4 circuit in parallel with the woofer is an impedance correction network that causes the woofer to appear as a nearly constant resistance (except at the driver resonance, which is not compensated for in this circuit). The remaining three networks in parallel with the W0838 woofer are traps that compensate for out-of-band peaks in the woofer response, that were observed in the close-miked measurements of the woofer; since the crossover is first-order, these peaks are not sufficiently attenuated by the basic crossover. It was found to be necessary to compensate for these peaks in order to obtain excellent pulse response for the system; also, empirically the speaker sounds much better with these corrections included. The LW1-RW1-CW1 network compensates for a peak at 1.24 kHz, LW2-CW2 reduces a peak at 3.13 kHz, and LW3-CW3 are to tame a peak at 1.91 kHz.

Here is the midrange crossover circuit for two Vifa P13WH midranges connected in series:


In this circuit, CM1 and LM1 carry out the basic bandpass function of the crossover, in order to blend the midranges with the woofer on the low-frequency end, and with the tweeter on the high-frequency end. RM3 is basically an attenuation resistor which brings the midrange response down to the proper level. However the LM2-CM2-RM2 network in parallel with RM3 provides a boost to compensate for a dip in the combined midrange-tweeter response at 2.07 kHz. The RM4-CM3 circuit in parallel with the midranges is an impedance-correcting network which causes the midrange impedance to appear approximately as a constant resistance, except at the driver resonant frequency, which was not necessary to compensate for in the crossover.

Finally, here is the crossover circuit for the Vifa H26TG-35 tweeter:


CT1 provides the basic highpass filter function of the tweeter crossover. RT2 is basically an attenuation resistor which sets the proper tweeter level. The LT1-CT2-RT3 network in parallel with RT2 provides a boost to compensate for a depression in the tweeter response near 10.2 kHz. LT3-CT4-RT4 is a trap circuit that compensates for a broad peak in the tweeter response around 13.9 kHz. The LT2-CT3 network is resonant at 20kHz and counteracts the roll-off of the tweeter near that frequency (note that although no resistance is shown in the LT2-CT3 network, inductor LT2 does exhibit significant AC resistance near 20 kHz). The components labelled LDx and CDx form a 2-stage allpass network that introduce a proper time delay in the tweeter response, in order to achieve time alignment with the midrange drivers; this network also compensates for a phase non-linearity in the tweeter response. The RT5-CT5 network in parallel with the tweeter is an impedance-correction circuit that causes the tweeter impedance to appear as a nearly constant resistance. This network, however, does not correct for the impedance rise at the driver resonant frequency; the RT6-CT5-LT4 network is included to compensate for this impedance peak near driver resonance.


Speaker Design Comments and Measurements


In this section I will present some more general comments regarding the design philosophy and procedure for this speaker system. I will also present some measurements of the final system and a discussion of some of their implications.

Much of the design of this speaker was carried out using the Virtual Crossover, which can carry out measurements as well as simulate crossover networks. It can also introduce arbitrary time delays between the drivers in order to determine the proper time alignment. These speakers were characterized using the "quasi-anechoic" measurement technique; they were not measured in an anechoic chamber, however anechoic measurements were approximated by truncating the speaker response in the time domain before room reflections became dominant. This method works well for the upper midrange and high frequencies, however it is difficult to separate the direct speaker response from the room response at low frequencies, so a different method was employed in that region of the audio spectrum.

For the low-frequency design the method of close-miking was used. The low-frequency enclosure is a ported design, however it is damped internally to eliminate resonances and the "boomy" sound sometimes associated with vented enclosure designs (this is actually similar to the effect achieved from stuffing a transmission line speaker, if you have ever listened to a transmission line without stuffing it sounds quite boomy). The close-miking method requires that the responses be measured right at the woofer and the port, and these responses are then vectorially added and adjusted for the different diameters of the woofer and the port. There is theoretical justification that the overall response thus obtained is an accurate portrayal of the low-frequency response in the far field of the speaker.

One of the most demanding tests of a loudspeaker is the square pulse response. This is primarily because in order to accurately reproduce a pulse in the time domain, both the amplitude response and the phase response versus frequency must be very nearly correct. This means that the amplitude response must be nearly flat, and the phase response nearly linear with frequency.

To be fair, it should be mentioned that there is some controversy as to how important the pulse test is in evaluating the quality of loudspeakers. While it is generally conceded that flat amplitude response is desirable, the role of phase response is more problematic. Before the advent of digital signal processing techniques, it was necessary to sacrifice linear phase response when crossover filters with sharp cutoffs were used, and this is still largely the case for passive crossovers. Also it is generally agreed that amplitude response is more important than phase response, at least to a point. Why then should we be concerned with phase response and with the time domain pulse response of a speaker?

In my opinion, we are dealing with subtle but still audible qualities of a speaker when we examine the pulse response. For example, one thing you will notice is that percussive sounds can be reproduced with amazing clarity by a speaker with superior pulse response, because these sounds are by nature highly localized in time. Imaging or the sense of localization in a recording can be outstanding when a speaker has excellent pulse response. In general, the sound has a "focus" and presence that is not found to the same degree in speakers with poor time domain pulse response. These qualities may not hit you over the head when you first audition the speaker in the showroom, but rather they become evident with time and extended listening; you will find that the more you listen to such a speaker the more you will like it, contrary to the usual experience. I find that the speakers I like best over the long term are those with superior pulse response.


The following curve shows the speaker response to a 0.5 millisecond pulse. The top trace shows the input signal at the speaker terminals, and the bottom trace shows the speaker response as measured on axis about 6 feet away from the speaker with a Brüel & Kjær 4006 studio microphone. The input pulse has been filtered so that it is band-limited to 20 kHz, which is why the edges have a finite slope. The speaker pulse response is truncated at the vertical line in the plot, which is roughly the demarcation between the early arrival sound and the part of the response that is dominated by room reflections:


Although some distortion of the input pulse is evident in the response, it should be remarked that the typical pulse responses of most speakers are much, much worse, even to the point that they do not resemble pulses at all. This pulse response is exceptionally clean and indicates superb fidelity.

It should be noted that the pulse response depends upon where the microphone is placed, both vertically and horizontally. The above response was measured right in front of the speaker about 6 feet away, nearly on the tweeter axis. Moving the microphone to the side causes the measured pulse response to deteriorate, partly because the satellite and low-frequency drivers are no longer in an optimum position relative to each other for best time coherence. The following curve shows the response about 30° off axis horizontally, but vertically still approximately at the tweeter level:


Some pulse response deterioration due to non-optimum time alignment of the drivers is evident in this figure, although the pulse is still quite good.

The frequency-domain measurements I will present use filtered pulses as excitation to cover the frequency range to be measured. MLS sequences can also be used to obtain the speaker impulse response, however the measurements for these speakers were carried out before MLS capability was included in the Virtual Crossover software. These pulses have sharp cutoff slopes, so that they ring in the time domain. This is one situation where we want the speaker output to ring, because the ringing is also present at the input. The equal-ripple passband and stopband method was used to generate the filtered pulses on the computer. The Virtual Crossover is capable of averaging over an arbitrary number of measurements in order to reduce the effects of extraneous noise.


The following curve shows both the input filtered pulse (top trace) and the measured response of the speaker (bottom trace) using a Brüel & Kjær 4006 studio microphone located on axis about 6 feet away from the speaker. The vertical line denotes the truncation position for the speaker response; everything to the right of this line is assumed to be zero. Of course that is not actually the case, however the majority of what is measured after the vertical line is the room response. The frequency content of this particular pulse extends out to 20 kHz:


The above measurement is in the time domain. By taking the FFT (Fast Fourier Transform) of both the input and output, and using the input FFT as reference, it is possible to obtain amplitude and phase information in the frequency domain. The following shows the amplitude response of the speaker, which is derived from the FFTs of the above time-domain waveforms:


It is seen that the early-arrival amplitude response is extremely flat. The overall amplitude variation from this result is 4.36 dB, or ±2.18 dB. Of course, as more of the response is included in the measurement (i.e. as the vertical line is moved to the right) the variations in frequency response increase, largely due to the effects of room reflections. Also, as previously mentioned, this result does not really tell the whole story at very low frequencies, where a different measurement technique must be used. However, the above result indicates that the speaker response is flat well into the midrange.

The following curve shows the phase response, also dervied from the same time-domain waveforms. The phase response is a bit tricky to display because any time delay in the measurement shows up as a linear phase term. Therefore it is necessary to subtract out an optimum delay term in order to display the true variations in the phase response, which has been done for the following curve:


The phase response vs. frequency is remarkably flat, showing a variation of only about ±10° when properly adjusted for the overall delay of the measurement. It is the above amplitude and phase characteristics that allow the speaker to reproduce time-domain square pulses with such high accuracy.


Home